
July 14, 2015
Every methodology needs a good diagram to describe how it works clearly and succinctly. Plus everyone loves circles and arrows ;). But we need your feedback!
This is our first attempt at an all-encompassing diagram, plus three other draft versions:

(Click on any of the diagrams to open a full-size version).
This is our first full-fledged draft, which shows most of the important parts of the GROWS® Method. We know what it means, but does it convey that meaning to anyone else correctly? Let’s go through the diagram from the bottom up and explain what we think this says.
GROWS is based on the idea of evolving a better system through the use of experiments. You adopt and validate both process and code using experiments, set up as intentional feedback loops. These are the loops at the bottom of this diagram, powering a “tank tread.” Feedback needs to consist of small steps, hence the small treads ;).
Feedback drives the Three R’s: doing the Right Thing, the Right Way, in a Rhythm.
These three R’s affect and involve everyone in the organization: executives, managers, developers, testers and QA, even the end users themselves.
GROWS does this by using the idea of Tracer Bullet Development, which fuels the growth helix from here in the diagram on up to the top.
With Tracer Bullet Development, you begin a software project with truly minimal viable thread of execution that runs all the way through from the frontend to the back. Each piece may not do anything more than a typical "Hello, World", but it’s all there, all connected. With that thinnest possible thread, you then grow the software (as shown by the increasing thickness of the helical arrow that exits at the top right corner).
But of course, the software isn’t the only thing that’s growing. The team members, the team itself, and the organization are growing too, proceeding up through the skill stages named in the diagram:
The fact that software growth and human skill growth are superimposed is not an accident. As your skill (and your team’s skill) increases, you produce better software, faster. The two aren’t tied in lock-step though. Individual’s skills will grow over time, and collectively the team’s overall skill will grow as well, but not at the same time or at the same rate as the software being produced. Growing people’s skills takes longer.
Skills grow through the use of feedback loops, too. In fact, since feedback is so important, we thought we should put a few tips about the proper use of feedback in GROWS on the diagram too.You run experiments using feedback loops that have these characteristics:
That’s the first draft. Now let’s look at from a few different angles.
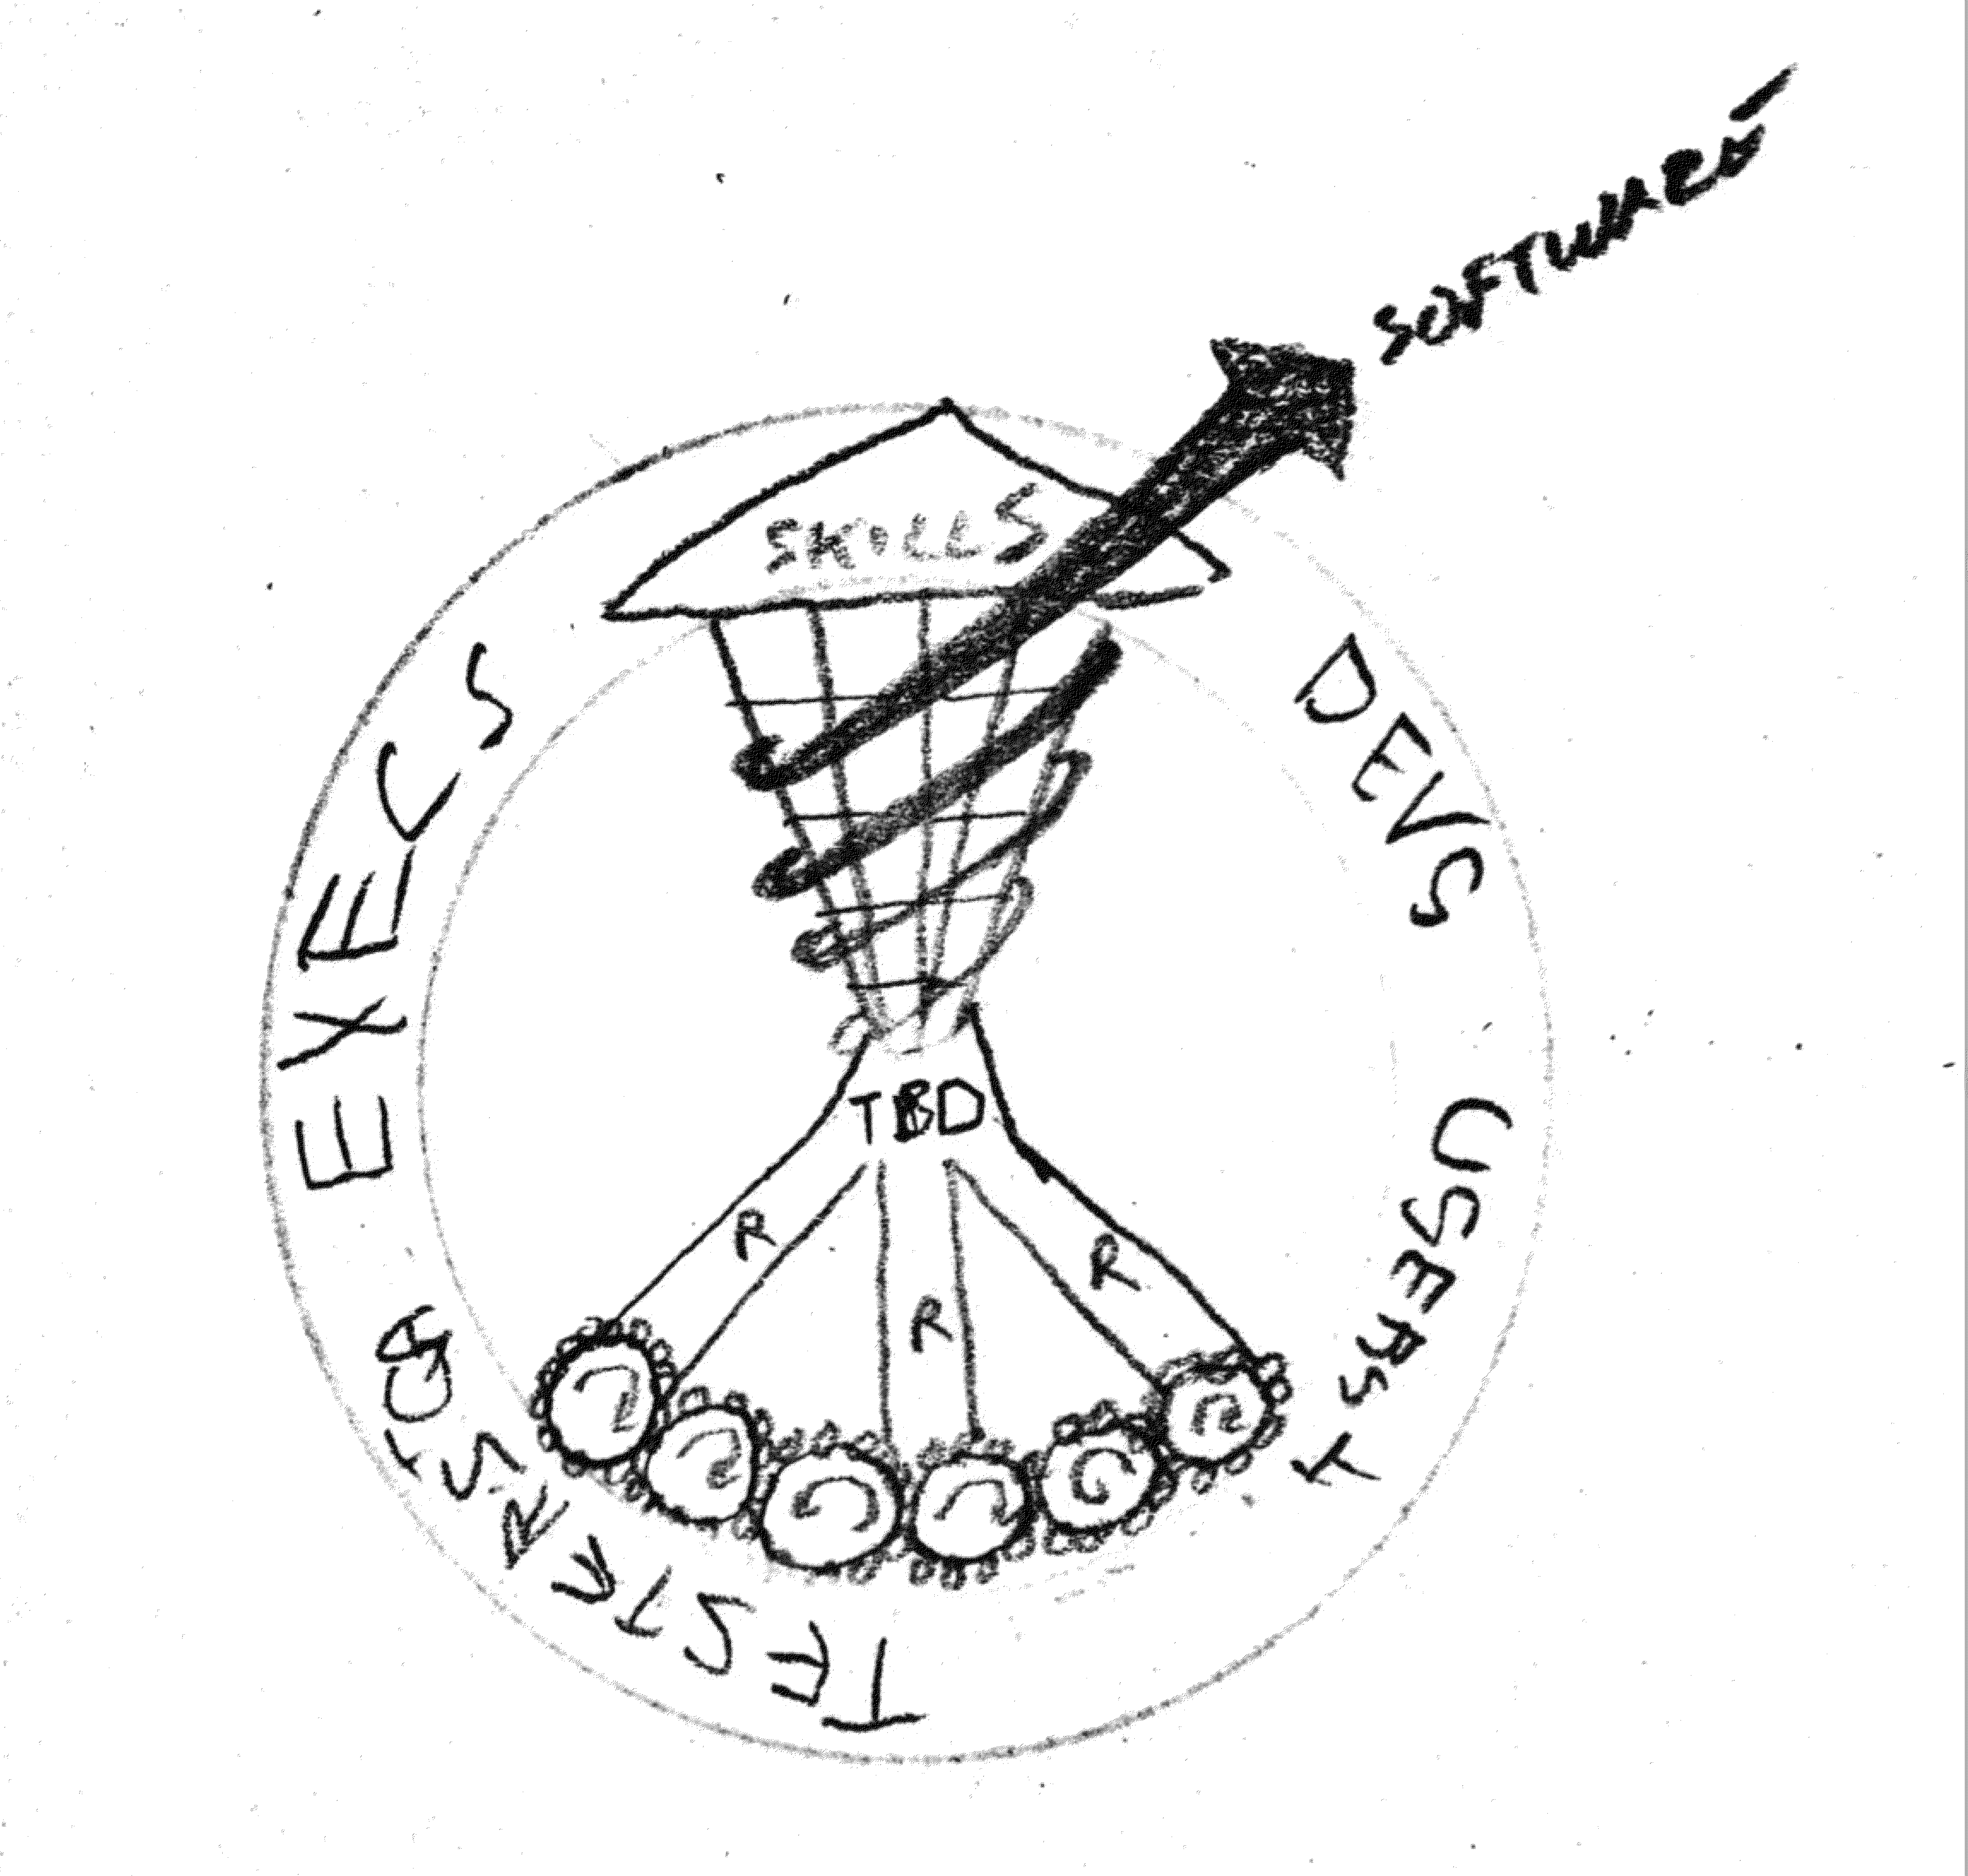
Here’s one possible variation. In this sketch, the outer shell has all the participants: executives, developers, testers & QA, users.
The feedback gears are meshed (and will be drawn correctly so they actually turn ;), and again drive the Three R’s, which support Tracer Bullet Development, which fuels the growth helix of learning and software.
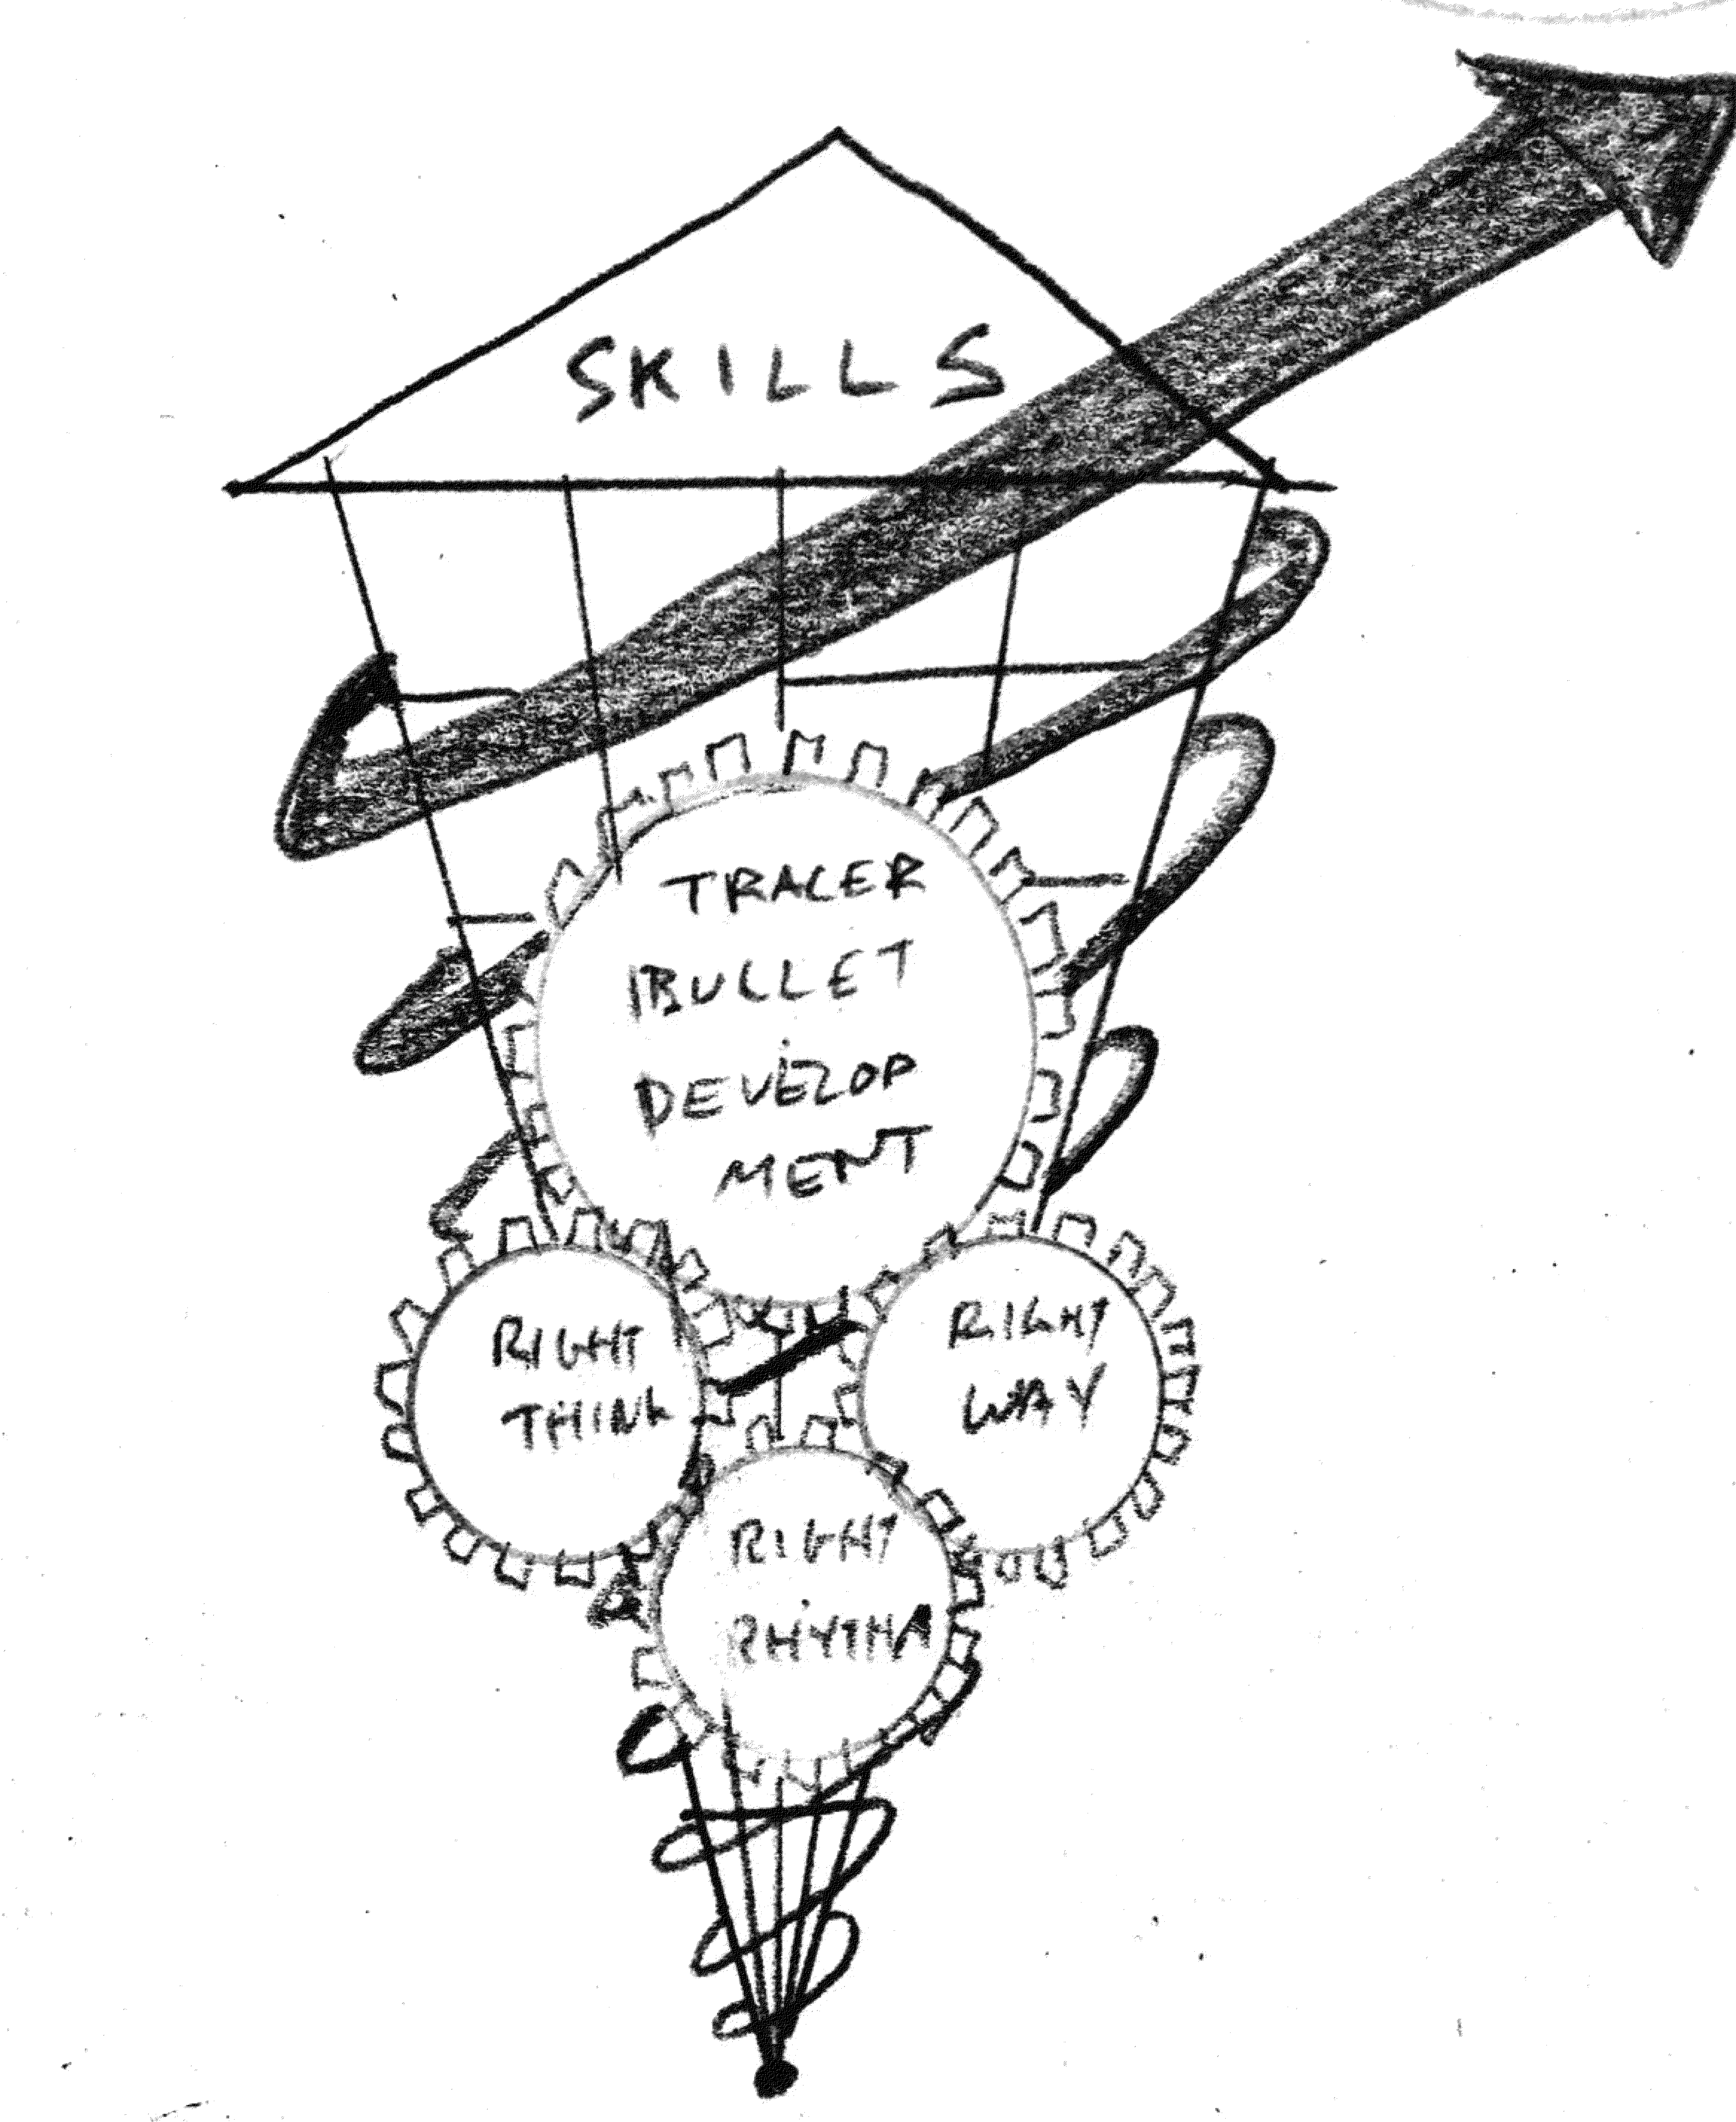
Here the gears representing feedback are named: the Three R’s are interlinked and drive the larger gear of Tracer Bullet Development, which is in turn driving the helical growth model. But you can’t really see the skill stages in this version, and we don’t have the notion of organizational inclusiveness. So what if we moved the gears out to the sides and labeled them as in this next version?

In this variation, the gears on the left show the major communities that must mesh and interact successfully: the executive and management group, the development team (which includes testers, QA, etc.), and the user community for whom you are building this software.
Over on the right, there are the Three R’s again, and all six gears must mesh with Tracer Bullet Development.
The whole thing powers the helical growth spiral (which would be labeled with the skill stage levels as in the first diagram).
This is just a rough sketch—a prototype. In the final version, we’ll add spacer gears or something similar so that the primary gears actually operate correctly.
This is our first round tracer bullet for developing a diagram that represents the GROWS Method. We’ve got a simple, hand-drawn prototype and sketches of three alternatives (always have at least three alternatives: one alternative is a trap; two is a dilemma, three is a real choice, /ht Jerry Weinberg). Now it’s time for feedback.
To vote on your favorite, goto this link: http://freeonlinesurveys.com/s/06ijs1YF and drag the diagrams in order, favorite on top, least favorite at the bottom.
For more in-depth comments, please email us at feedback@growsmethod.com
— /\ndy
Follow @growsmethod in the Fediverse, or subscribe to our mailing list:
Sign up for more information on how you can participate and use the GROWS Method®. We will not use your email for any other purpose.